

Your Email Revenue is 50% Higher Than Klaviyo Shows
Klaviyo's 5-day attribution window captures only direct conversions. Your email's true contribution is 20-50% higher. Here's how to prove it and justify bigger budgets.
 Arpit Mehar

8 min read
You're looking at your Klaviyo dashboard. Email revenue for the last month: $18,400. That's 16% of your total revenue.
Then you check your Google Analytics. Email traffic: $28,600. That's 24% of total revenue.
One number is wrong. You're not sure which one. And the difference is costing you real money in budget decisions.
This is the attribution problem. Klaviyo shows one number. Your analytics show another. Your email is actually worth more than Klaviyo says, but you don't know how much more. So you keep the retention budget flat, shift money to acquisition, and leave revenue on the table.
This post walks through why the gap exists, what's actually happening in your data, and how to model email's true revenue contribution. Not to replace Klaviyo's numbers. But to complete the picture.
Why the 5-day window is both right and incomplete
Klaviyo uses a 5-day click attribution window. Here's what that means: if someone clicks an email on Monday and buys on Friday, Klaviyo attributes that revenue to the email. If they click on Monday and buy the following Tuesday (6 days later), Klaviyo doesn't attribute it.
This window exists for a reason. It's conservative. It only counts revenue from people who directly converted from an email action. That's reliable. It's also incomplete.
Consider a real customer journey: A customer opens your browse abandonment email on Tuesday at 2 PM. They don't click. They close the email. But something stuck. On Thursday, they do a Google search for "blue running shoes." They land on your site through organic search. They buy Friday.
In Klaviyo, this is zero revenue attributed to email. The click window never triggered. In Google Analytics, this is organic traffic. Not email. In reality, the email drove the purchase. It just didn't drive the click.
This happens constantly. A customer sees your post-purchase email. Doesn't click. But the subject line said "Here's how to extend the life of your purchase." They read it. They remember it. A week later, they buy the accessory. The attribution goes to whichever channel they clicked through to get there.
Klaviyo's 5-day click window captures last-click conversions only. Studies across DTC brands show that 30-50% of email-influenced purchases happen outside that window or through a different channel after email exposure.
If you want to understand which metrics actually matter in Klaviyo, read about the metrics that track revenue versus vanity metrics. That blog explains what to look at. This one explains what's actually happening behind those numbers.
The three attribution models and which one actually matters
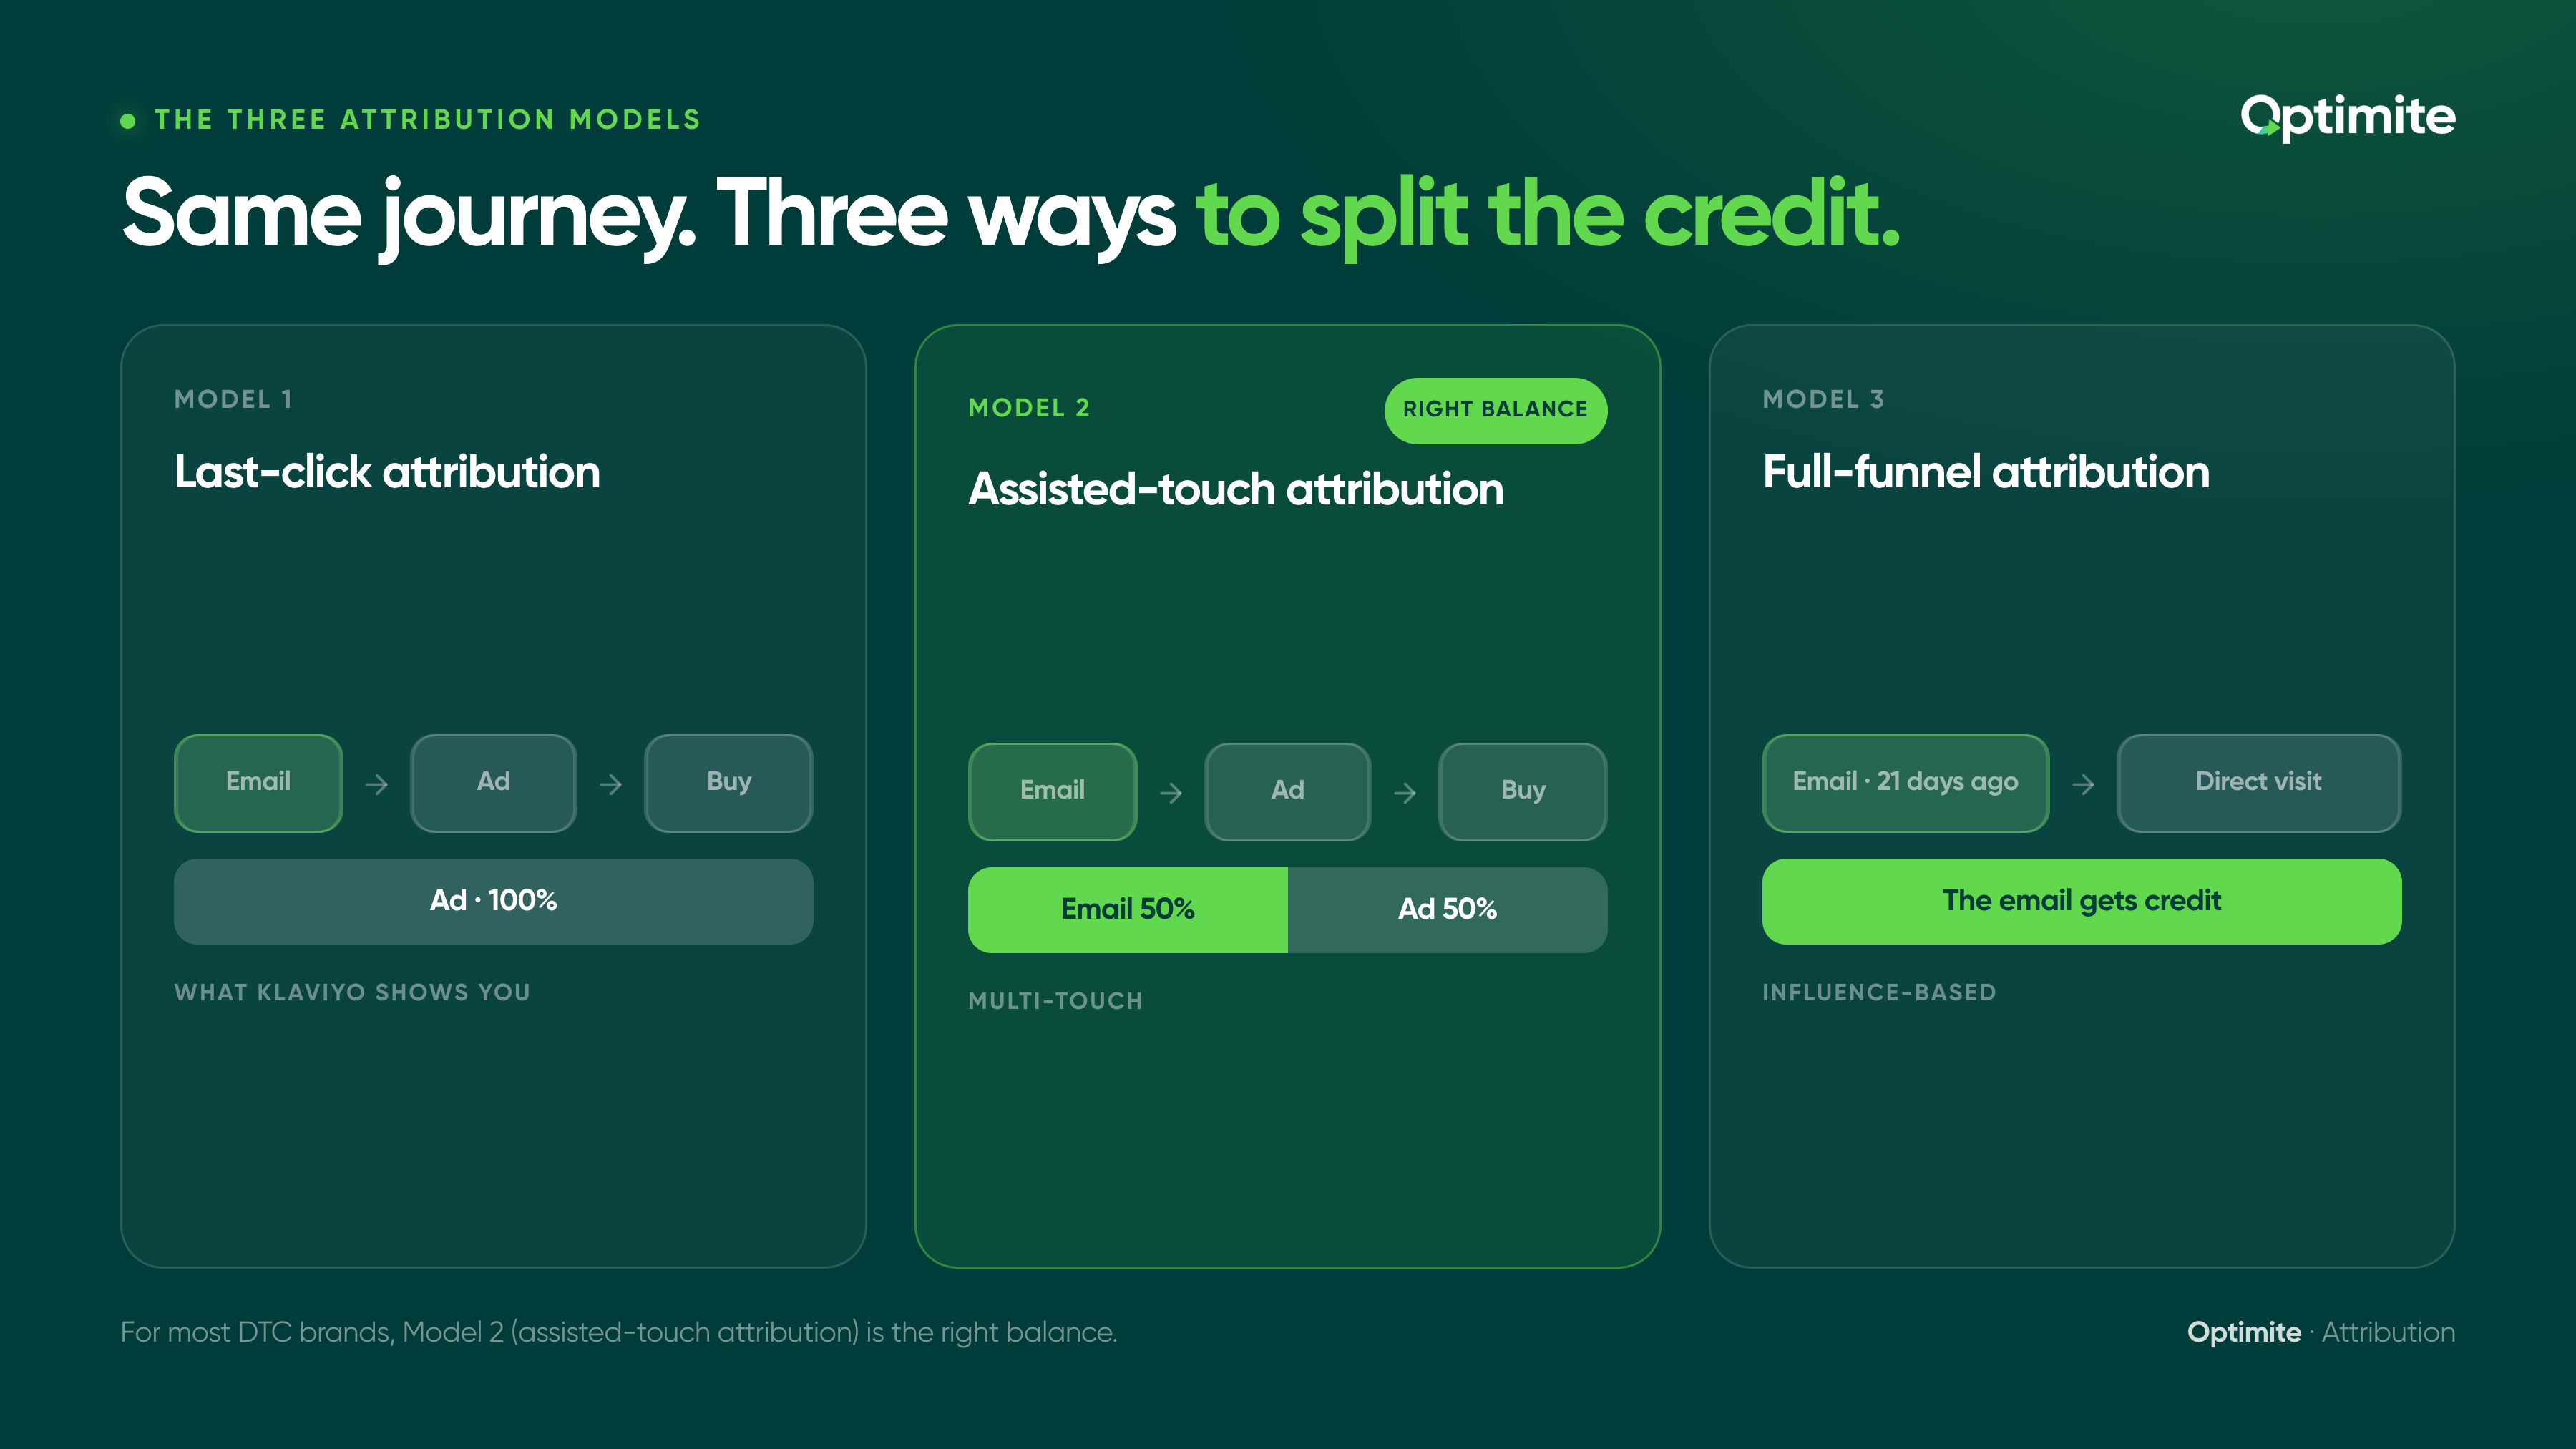
There are three ways to model email's real revenue contribution. Each answers a different question.
Model 1: Last-click attribution (what Klaviyo shows you).
This model says: credit the channel that drove the final click before purchase. If someone saw an email, then clicked a paid ad, then bought, the ad gets 100% credit.
What it captures: Direct conversions from email. Conservative, reliable revenue numbers. What it misses: Email's influence when it didn't drive the final click. When to use it: To understand direct email conversion performance. To build trust in email ROI with conservative stakeholders. The problem: It hides the full picture. A 16% email revenue share in Klaviyo might actually be 24% when you account for assisted conversions.
Model 2: Assisted-touch attribution (multi-touch).
This model says: credit all channels that touched the customer before purchase. If someone saw an email, clicked an ad, then bought, split the credit. Email gets 50%, the ad gets 50%.
What it captures: Email's influence across the entire journey, not just final click. What it misses: How much weight to give each touch (did the email or the ad matter more?). When to use it: To understand email's true influence. To justify retention budgets that compete with acquisition. The complexity: You have to decide how to weight each touch. There are frameworks for this, but it's not straightforward.
Model 3: Full-funnel attribution (influence-based).
This model says: credit any channel the customer touched before they bought, regardless of when. If someone saw your email 21 days ago and then bought today through a direct visit, the email gets credit.
What it captures: Email's complete influence, including brand awareness and long-tail conversions. What it misses: Nothing, in theory. But it requires pixel-level tracking across channels. When to use it: If you have advanced analytics infrastructure (GA4 + CDP) and want the most complete picture. The complexity: High. Requires data integration and custom setup.
For most DTC brands, Model 2 (assisted-touch attribution) is the right balance. It surfaces email's true influence without requiring a data science team.
Start with assisted-touch attribution. It's simple enough to build in a spreadsheet, powerful enough to change budget decisions, and accurate enough to justify retention investment.
The real revenue gap: three brand examples
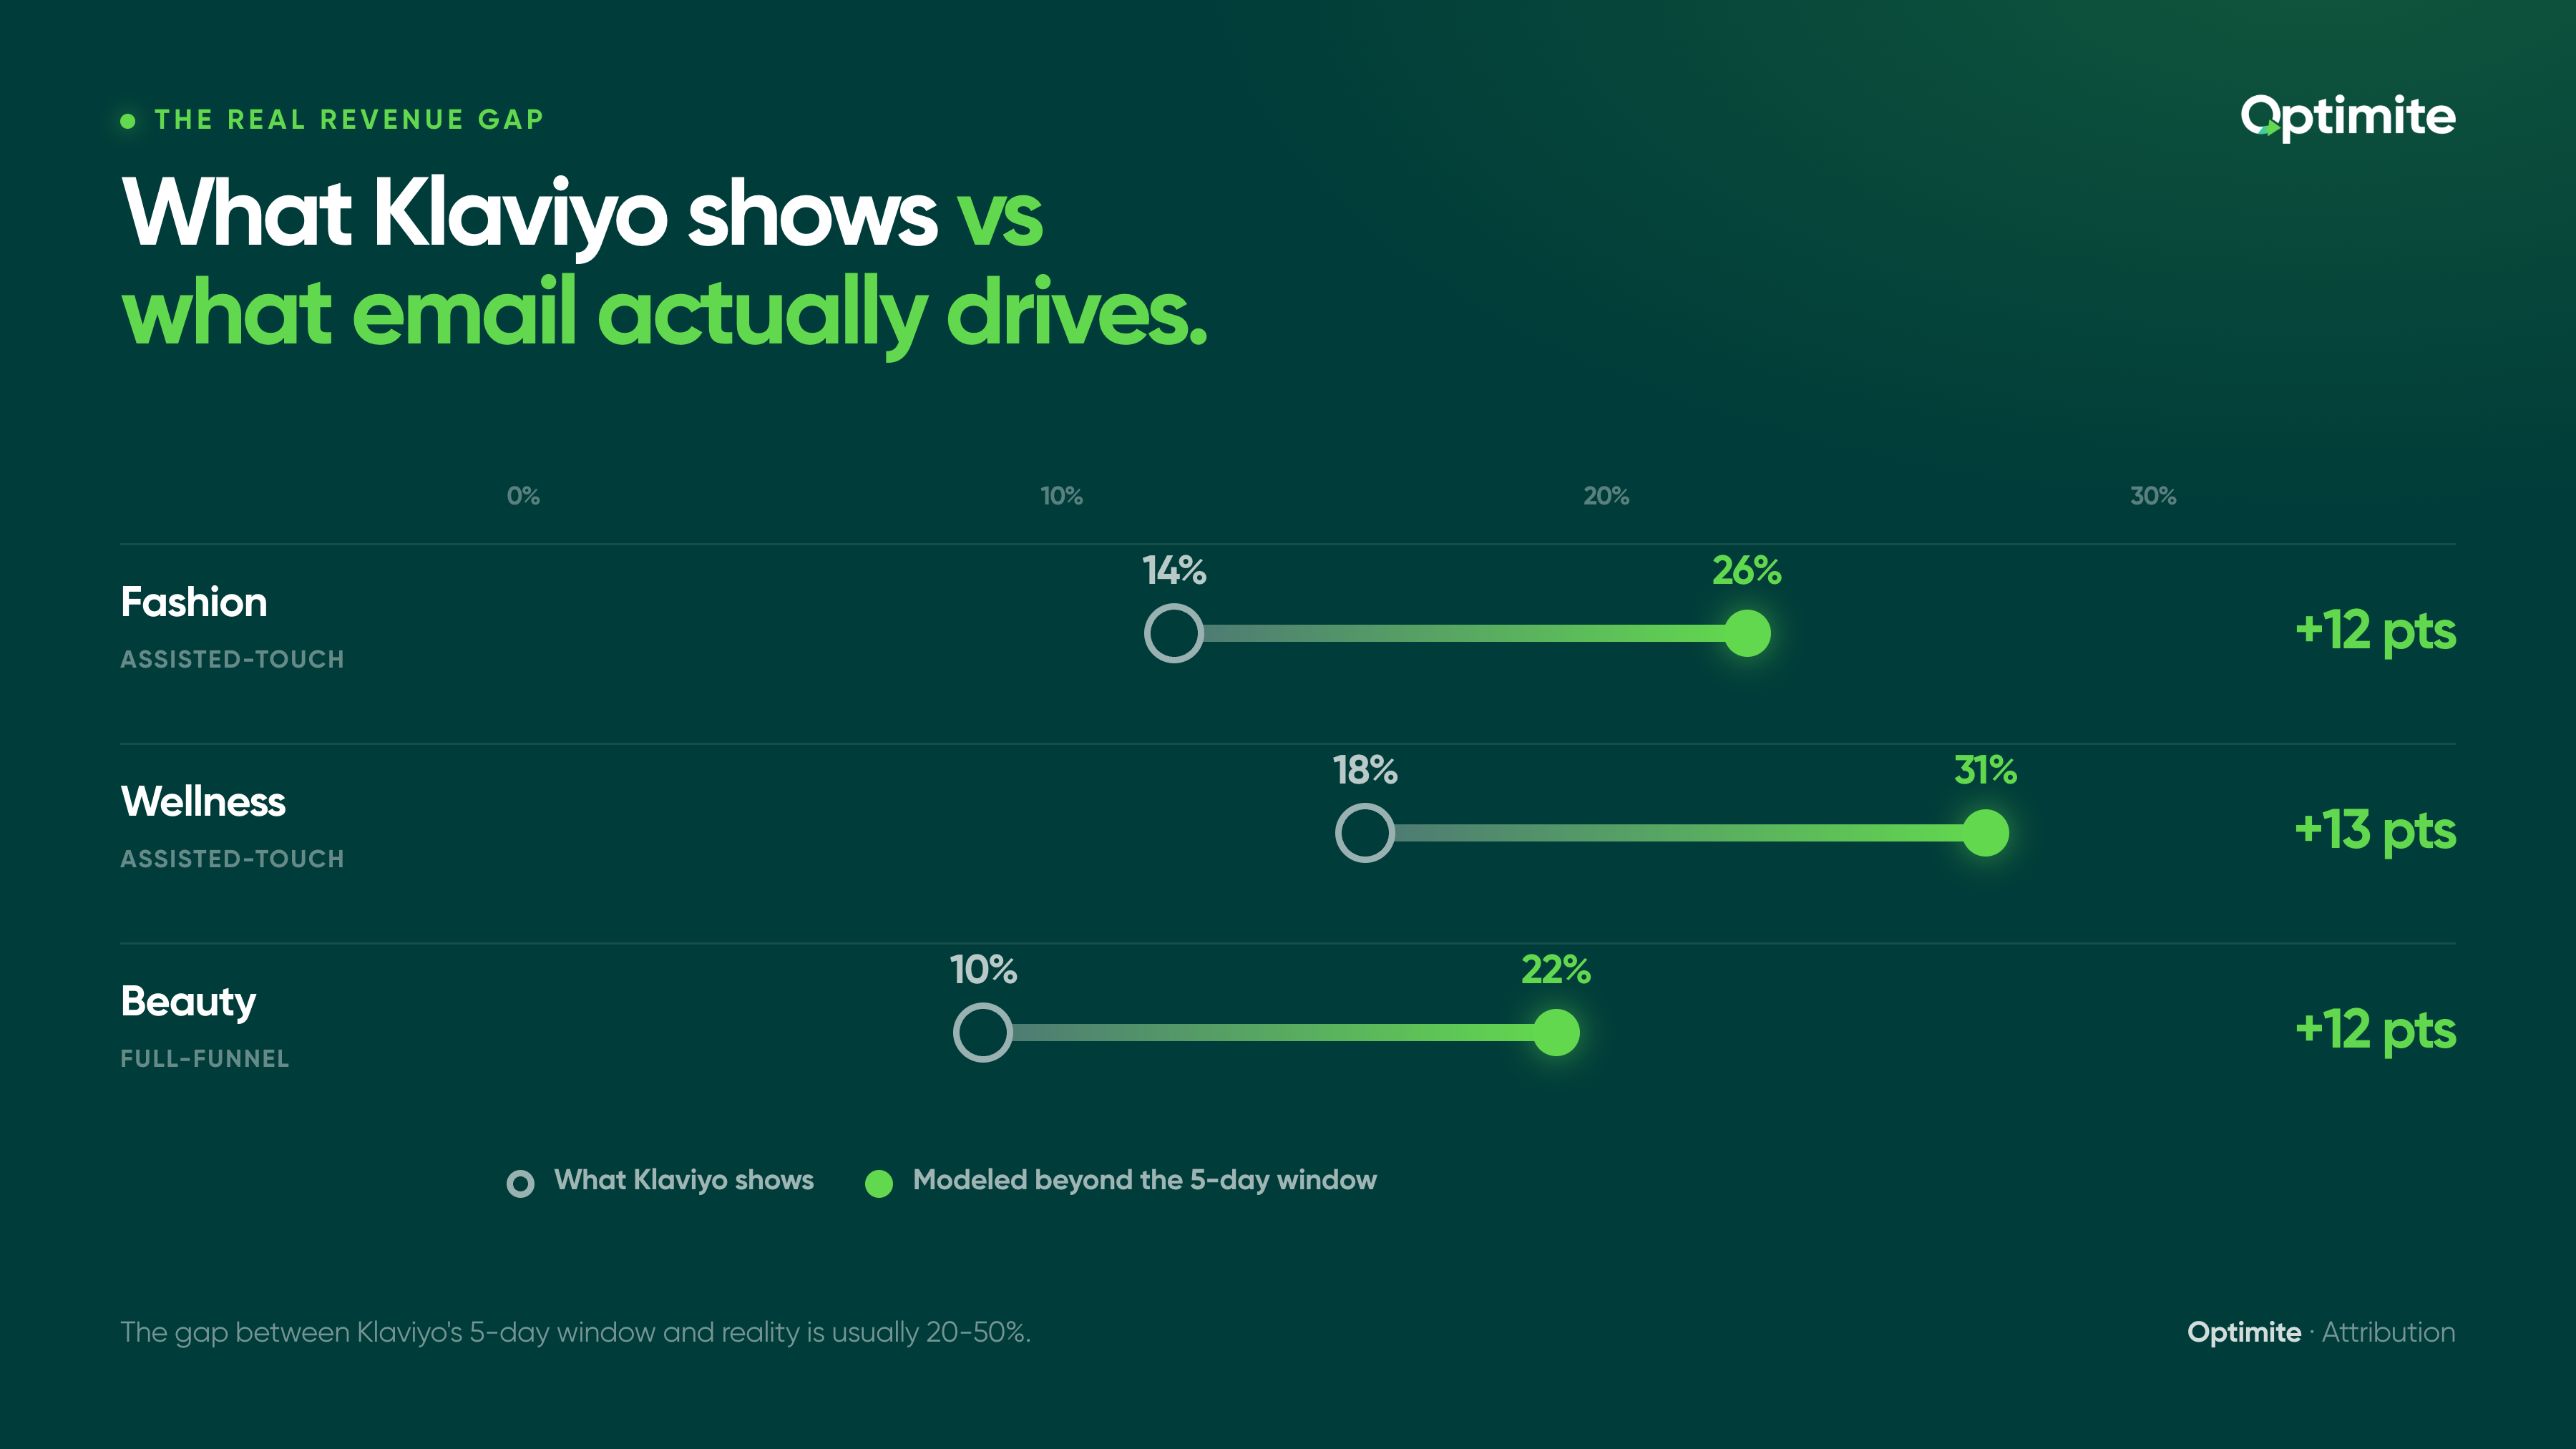
Let's see what changes when you model attribution beyond the 5-day window.
Brand 1: Fashion (high-consideration, longer decision window).
What Klaviyo shows: 14% of revenue from email. What assisted-touch attribution shows: 26% of revenue from email. The difference: Browse abandonment emails don't always convert immediately. But they prime customers to consider a product. 7-10 days later, the customer searches for that product, finds it through organic search, and buys. The email influenced the purchase but didn't drive the final click. Business impact: This brand thought email ROI was weak. In reality, it was driving $150K more revenue annually than the dashboard showed. That changes how much they're willing to invest in email flows and SMS.
Brand 2: Wellness (subscription model, high-frequency replenishment).
What Klaviyo shows: 18% of revenue from email. What assisted-touch attribution shows: 31% of revenue from email. The difference: Replenishment reminders don't always convert on the first send. Customer sees email 1. Doesn't click. Sees email 2 days later. Still doesn't click. Gets SMS reminder 3 days later. Clicks SMS. Buys. In Klaviyo, SMS gets 100% credit. In assisted-touch, both the email sequence and SMS share credit for warming up the customer. Business impact: SMS looks like 40% of revenue. Email looks like 18%. In reality, email is setting up SMS for success. The retention team needs both channels working together, and assisted-touch shows that.
Brand 3: Beauty (high ad spend, brand awareness challenge).
What Klaviyo shows: 10% of revenue from email. What full-funnel attribution shows: 22% of revenue from email. The difference: A customer sees a welcome email on day 1. Doesn't engage much. Sees a retargeting ad on day 5. Doesn't click. On day 9, they do a brand-name search and find your site organically. They buy. The email didn't drive the final click, but it planted awareness. Full-funnel attribution credits the email for that initial brand exposure. Business impact: This brand was cutting email budget because ROI looked weak. Full-funnel attribution showed email was actually driving brand awareness that converted later. Cutting email would have hurt other channels' performance downstream.
Building your own attribution model in Klaviyo
You don't need a data scientist to build this. Here's how to start.
Framework 1: The spreadsheet model (quarterly, manual, works at any scale).
Step 1: Pull your Klaviyo data. Go to your flows and campaigns. For your top 5 revenue-generating flows, note:
- Total recipients
- Total clicks
- Klaviyo-attributed revenue (5-day window)
Step 2: Pull your Google Analytics data. Filter for email traffic source. Note:
- Total sessions from email
- Total revenue attributed to email (GA default is last-click)
Step 3: Calculate the gap. Klaviyo total revenue - GA email revenue = assisted conversions (purchases influenced by email but attributed elsewhere)
Step 4: Model assisted-touch. If the gap is 30% of Klaviyo revenue, then email's true contribution is Klaviyo revenue + 30% of the gap.
Example: Klaviyo shows $10K email revenue. GA shows $14K from email source. Gap is $4K. This means email influenced an additional $4K in purchases that closed through other channels. True email contribution: $10K + 50% of $4K = $12K. (You assign 50% credit to email, 50% to the channel that drove the final conversion.)
Framework 2: The flow-based model (monthly, native Klaviyo).
Step 1: Tag customers in Klaviyo based on flow engagement. Create segments:
- Clicked email from flow X
- Did not click email from flow X
Step 2: Pull purchase data 7-30 days post-email. For each segment, calculate: what percentage purchased in the next 7 days? 14 days? 30 days?
Step 3: Calculate assisted revenue. Revenue from "clicked email" segment minus revenue from "did not click" segment = assisted revenue from that email.
Step 4: Aggregate by flow. Sum assisted revenue across all flows. Divide by total revenue = email's true contribution percentage.
This model takes longer but it's native to Klaviyo. No spreadsheet shuffling.
Framework 3: The integration model (weekly, automated).
If you have GA4 + a basic CDP or Zapier setup:
- Connect Klaviyo to Google Analytics via customer ID
- Automate weekly pulls of email engagement + purchase data
- Calculate assisted-touch ratio automatically
- Feed results back into a dashboard
This is the most effort upfront but it runs on its own. You get fresh attribution numbers every week.
Don't obsess over perfect attribution. The gap between Klaviyo's 5-day window and reality is usually 20-50%. You don't need pixel-perfect accuracy to justify moving budget from acquisition to retention. A conservative assisted-touch model is enough.
Choosing your model: the decision framework
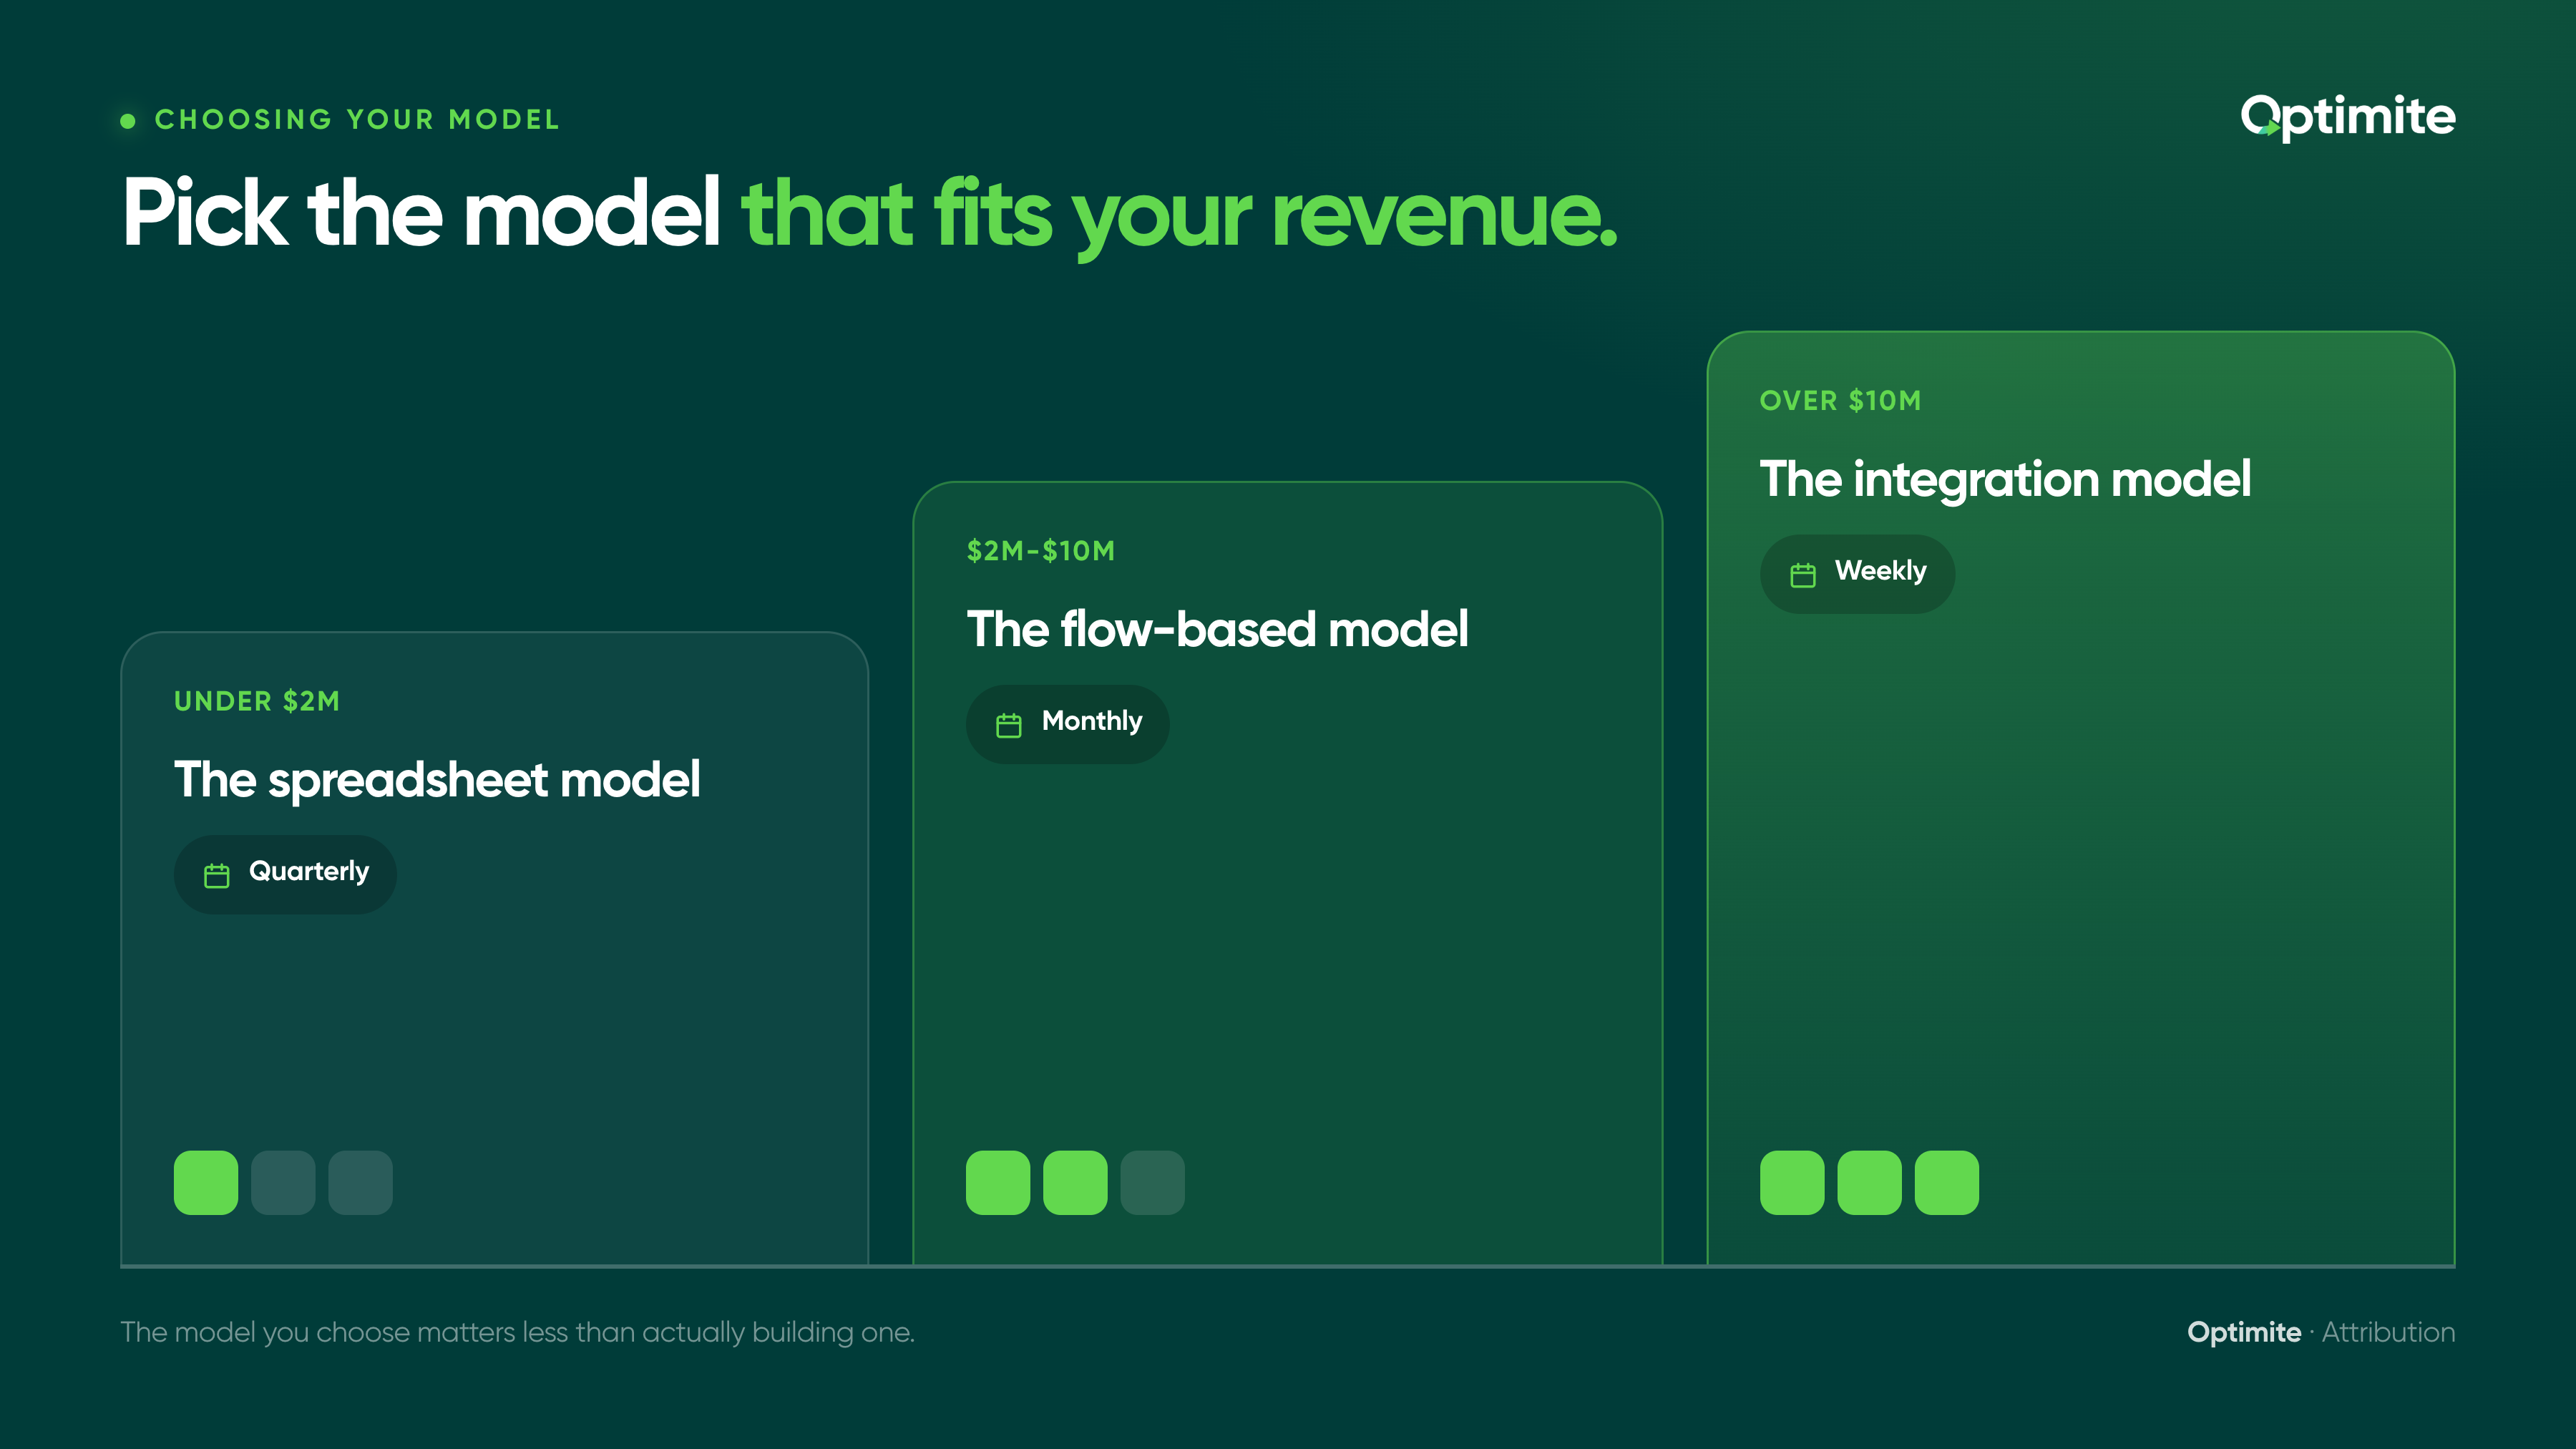
Which framework should you actually use? It depends on your scale and how much the gap matters to your decisions.
If you're under $2M in revenue: Use the spreadsheet model. Do it quarterly. Spend 2 hours pulling data. You'll find your 20-30% gap and that's enough to inform budget decisions.
If you're $2M-$10M in revenue: Use the flow-based model. Do it monthly. It takes longer but it's more accurate and it's native to Klaviyo. This is where the investment in true attribution starts to pay off.
If you're over $10M in revenue: Use the integration model. Wire Klaviyo to GA4 and automate it. The accuracy compounds and the weekly feedback loop lets you optimize faster.
But here's the bigger point: the model you choose matters less than actually building one. Most brands run on Klaviyo's 5-day window and assume that's the whole story. You're now ahead of 80% of your competitors just by knowing the gap exists.
Start with the spreadsheet model. Take one afternoon. Find the real number. Then decide if you want to go deeper.
When your retention team shows you that email is driving 26% of revenue instead of 16%, the conversation shifts. You're not fighting for budget against acquisition anymore. You're optimizing the channel that's actually performing best. And that changes everything.
Want help modeling your actual email revenue or building a retention system that proves its own ROI? Let's talk about your retention strategy. We work with brands across wellness, beauty, fashion, and food and beverage to build attribution models that justify bigger retention budgets.


