8 Shopify Metrics That Predict Churn Before It Happens
Most brands react to churn. The best brands predict it. Here are the eight metrics that tell you a customer is about to leave.

Most brands react to churn. A customer stops buying. They realize something's wrong. They scramble to win them back.
The best brands predict it.
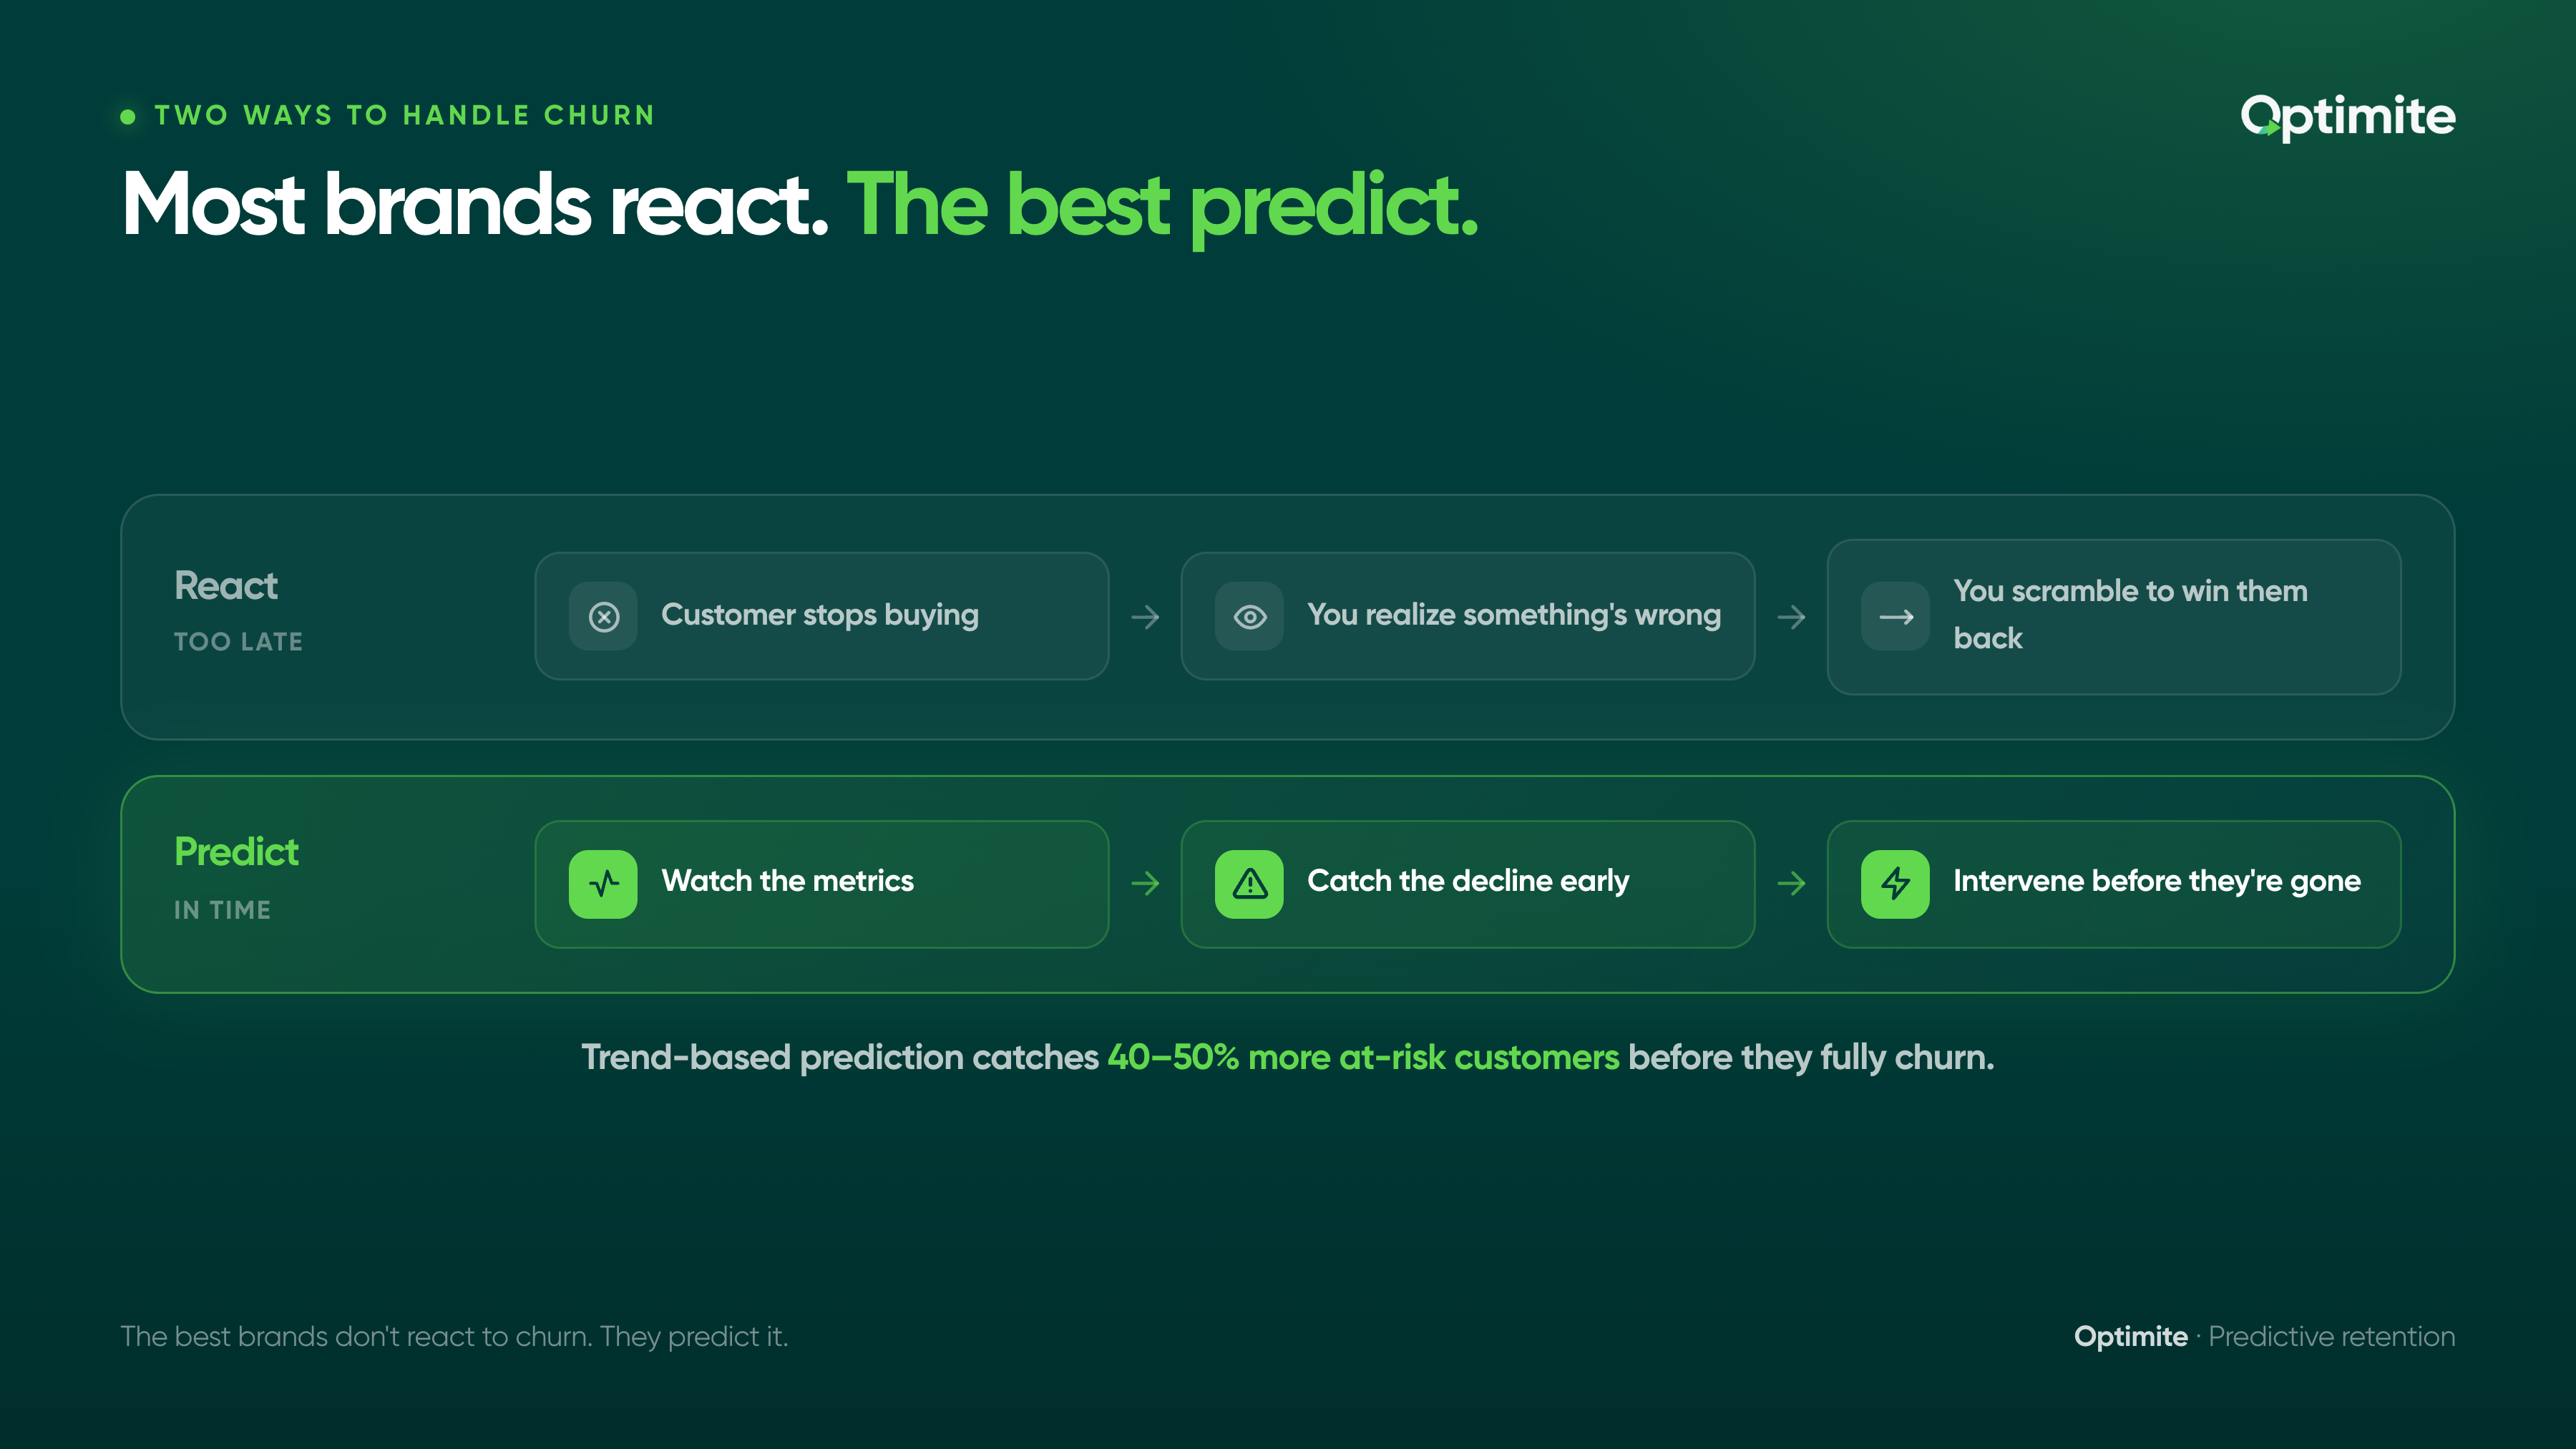
They know which metrics signal a customer is about to leave. They catch the decline early. They intervene before the customer is gone.
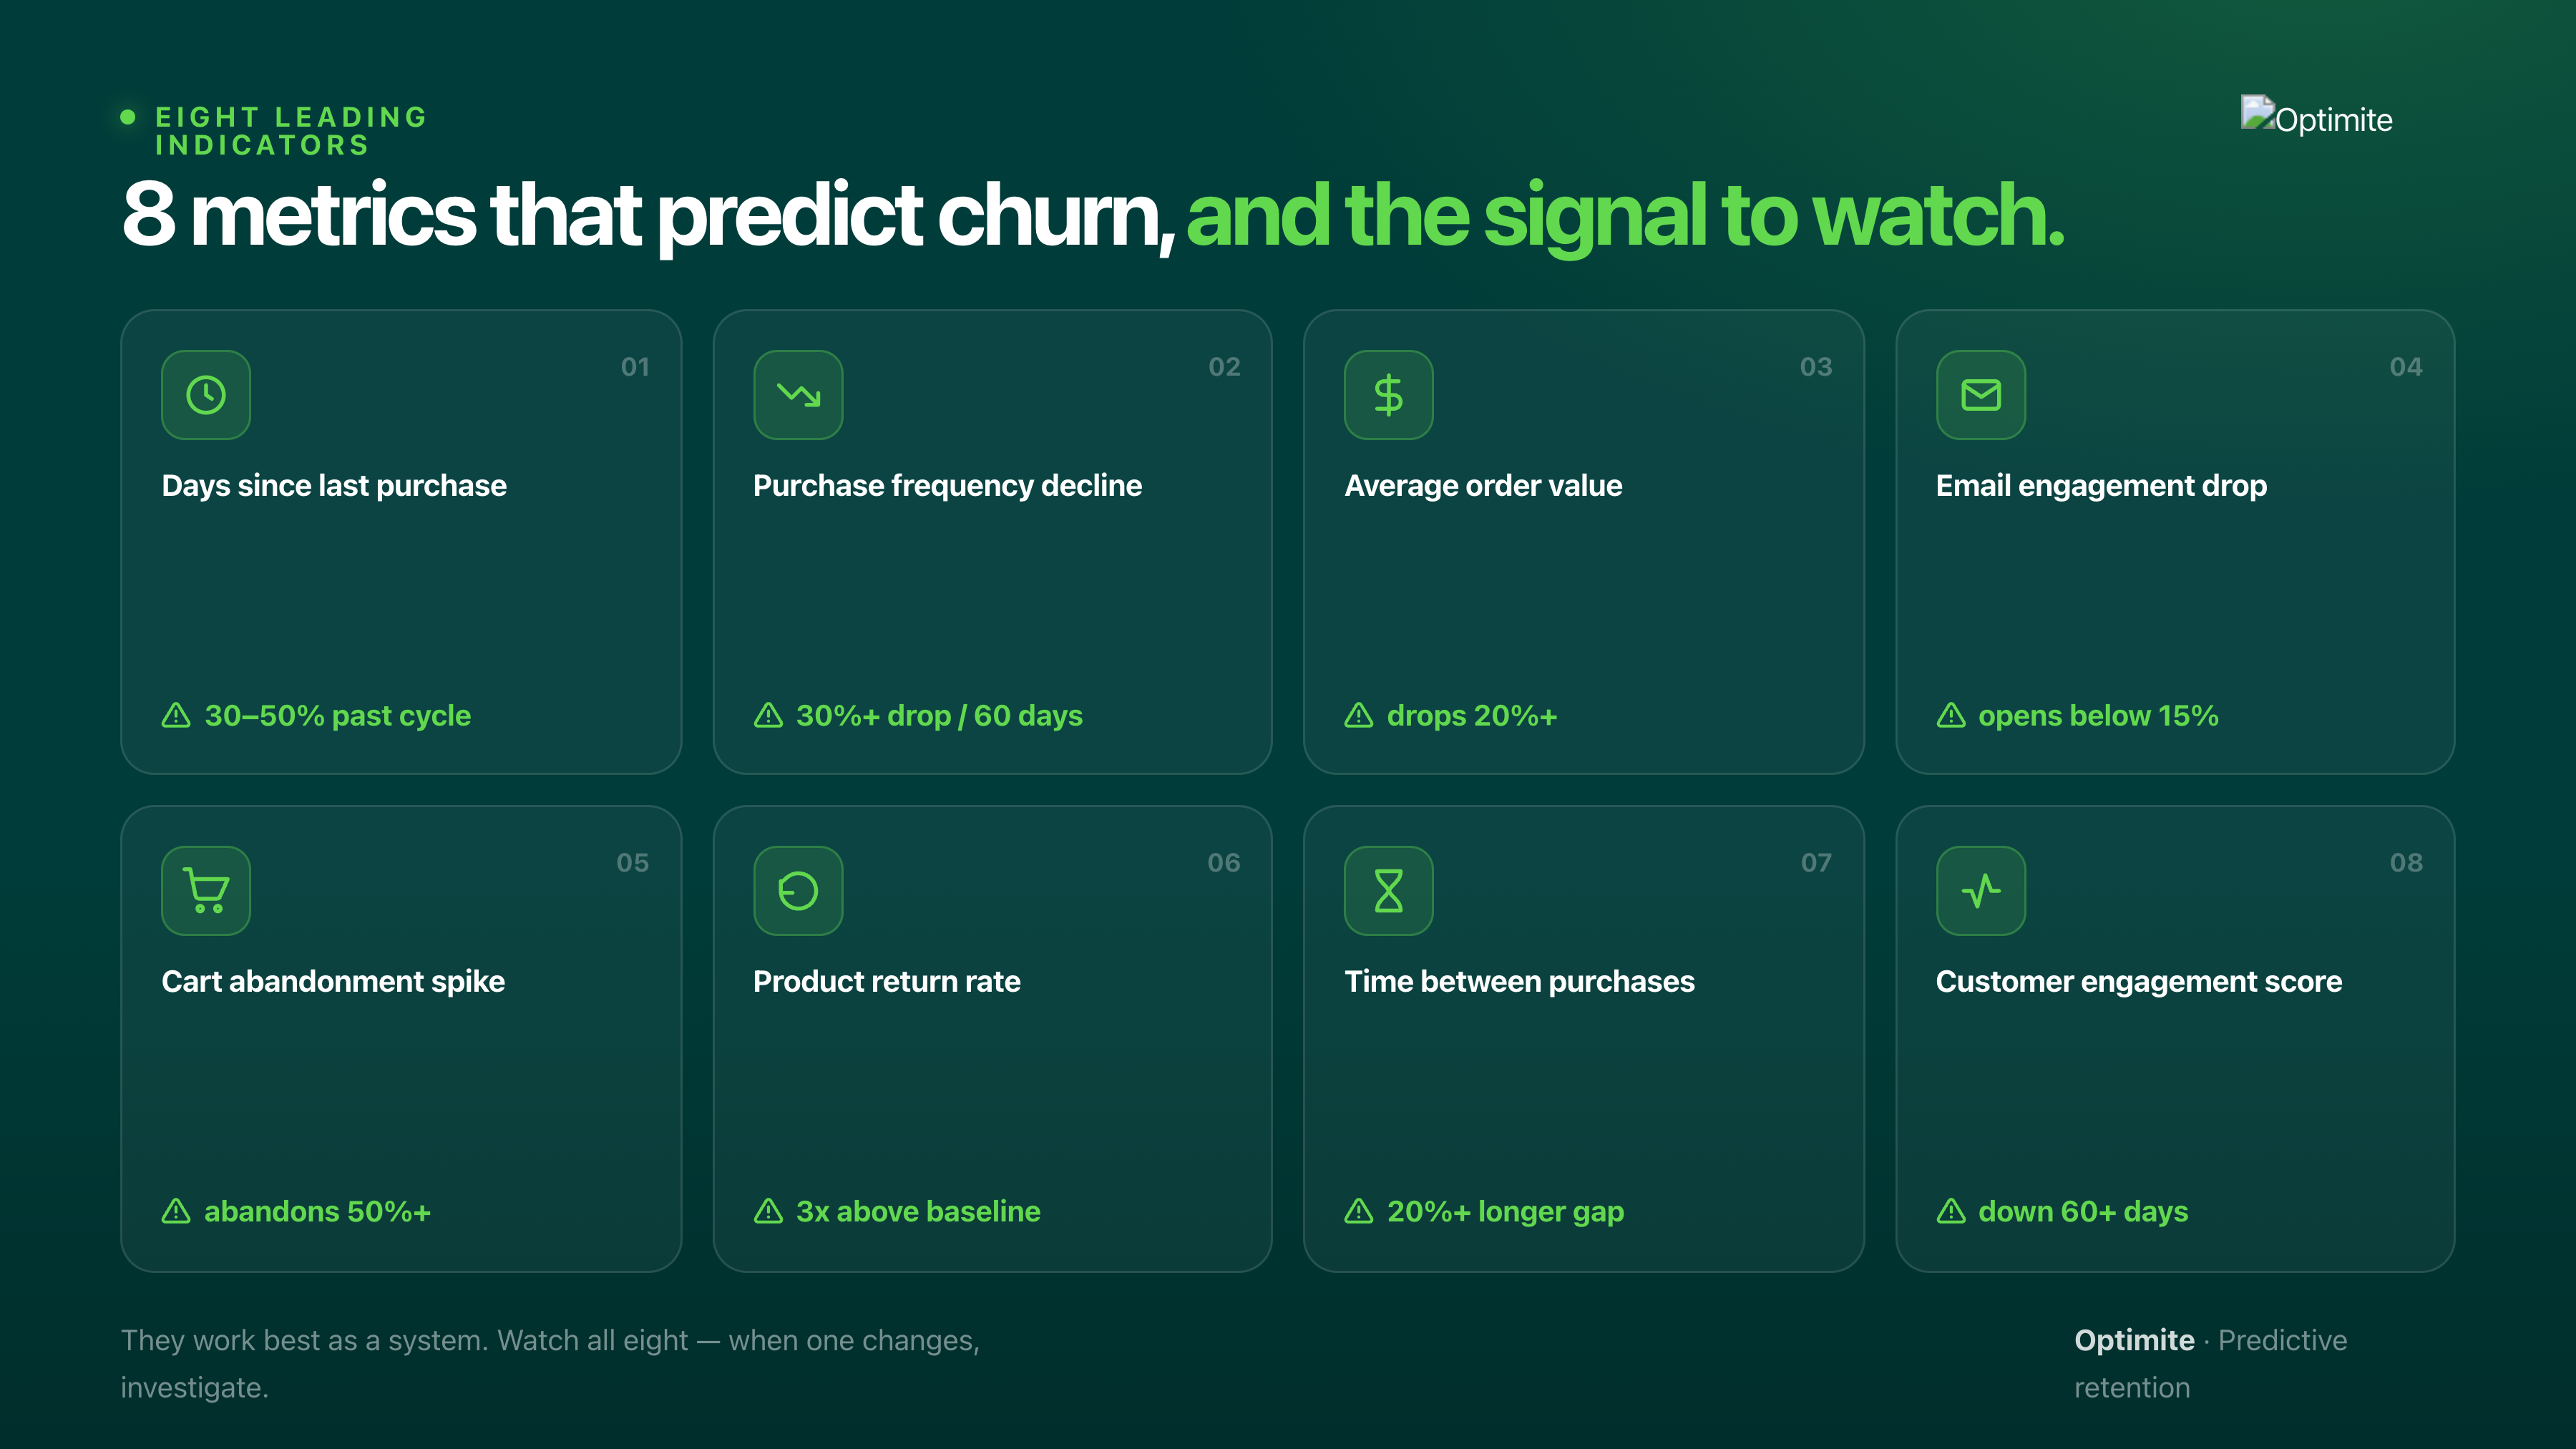
The difference is eight metrics. Eight leading indicators that tell you a customer's engagement is declining before they actually churn.
This post walks through those eight metrics. What they measure. Why they predict churn. What the warning signal looks like. How to act on it.
Metric 1: Days Since Last Purchase
This is the single most predictive metric for churn. It's simple: how many days has it been since a customer's last order?
Why it predicts churn: A customer who bought three weeks ago is still engaged. A customer who hasn't bought in 180 days has mentally moved on. The longer the gap, the higher the probability they'll never buy again.
What the warning signal looks like: Every vertical has a natural repurchase cycle. A supplement brand's cycle is 45 days. A fashion brand's is 90 days. An e-commerce furniture brand's is 400 days. The warning signal is when a customer exceeds their natural cycle by 30-50%.
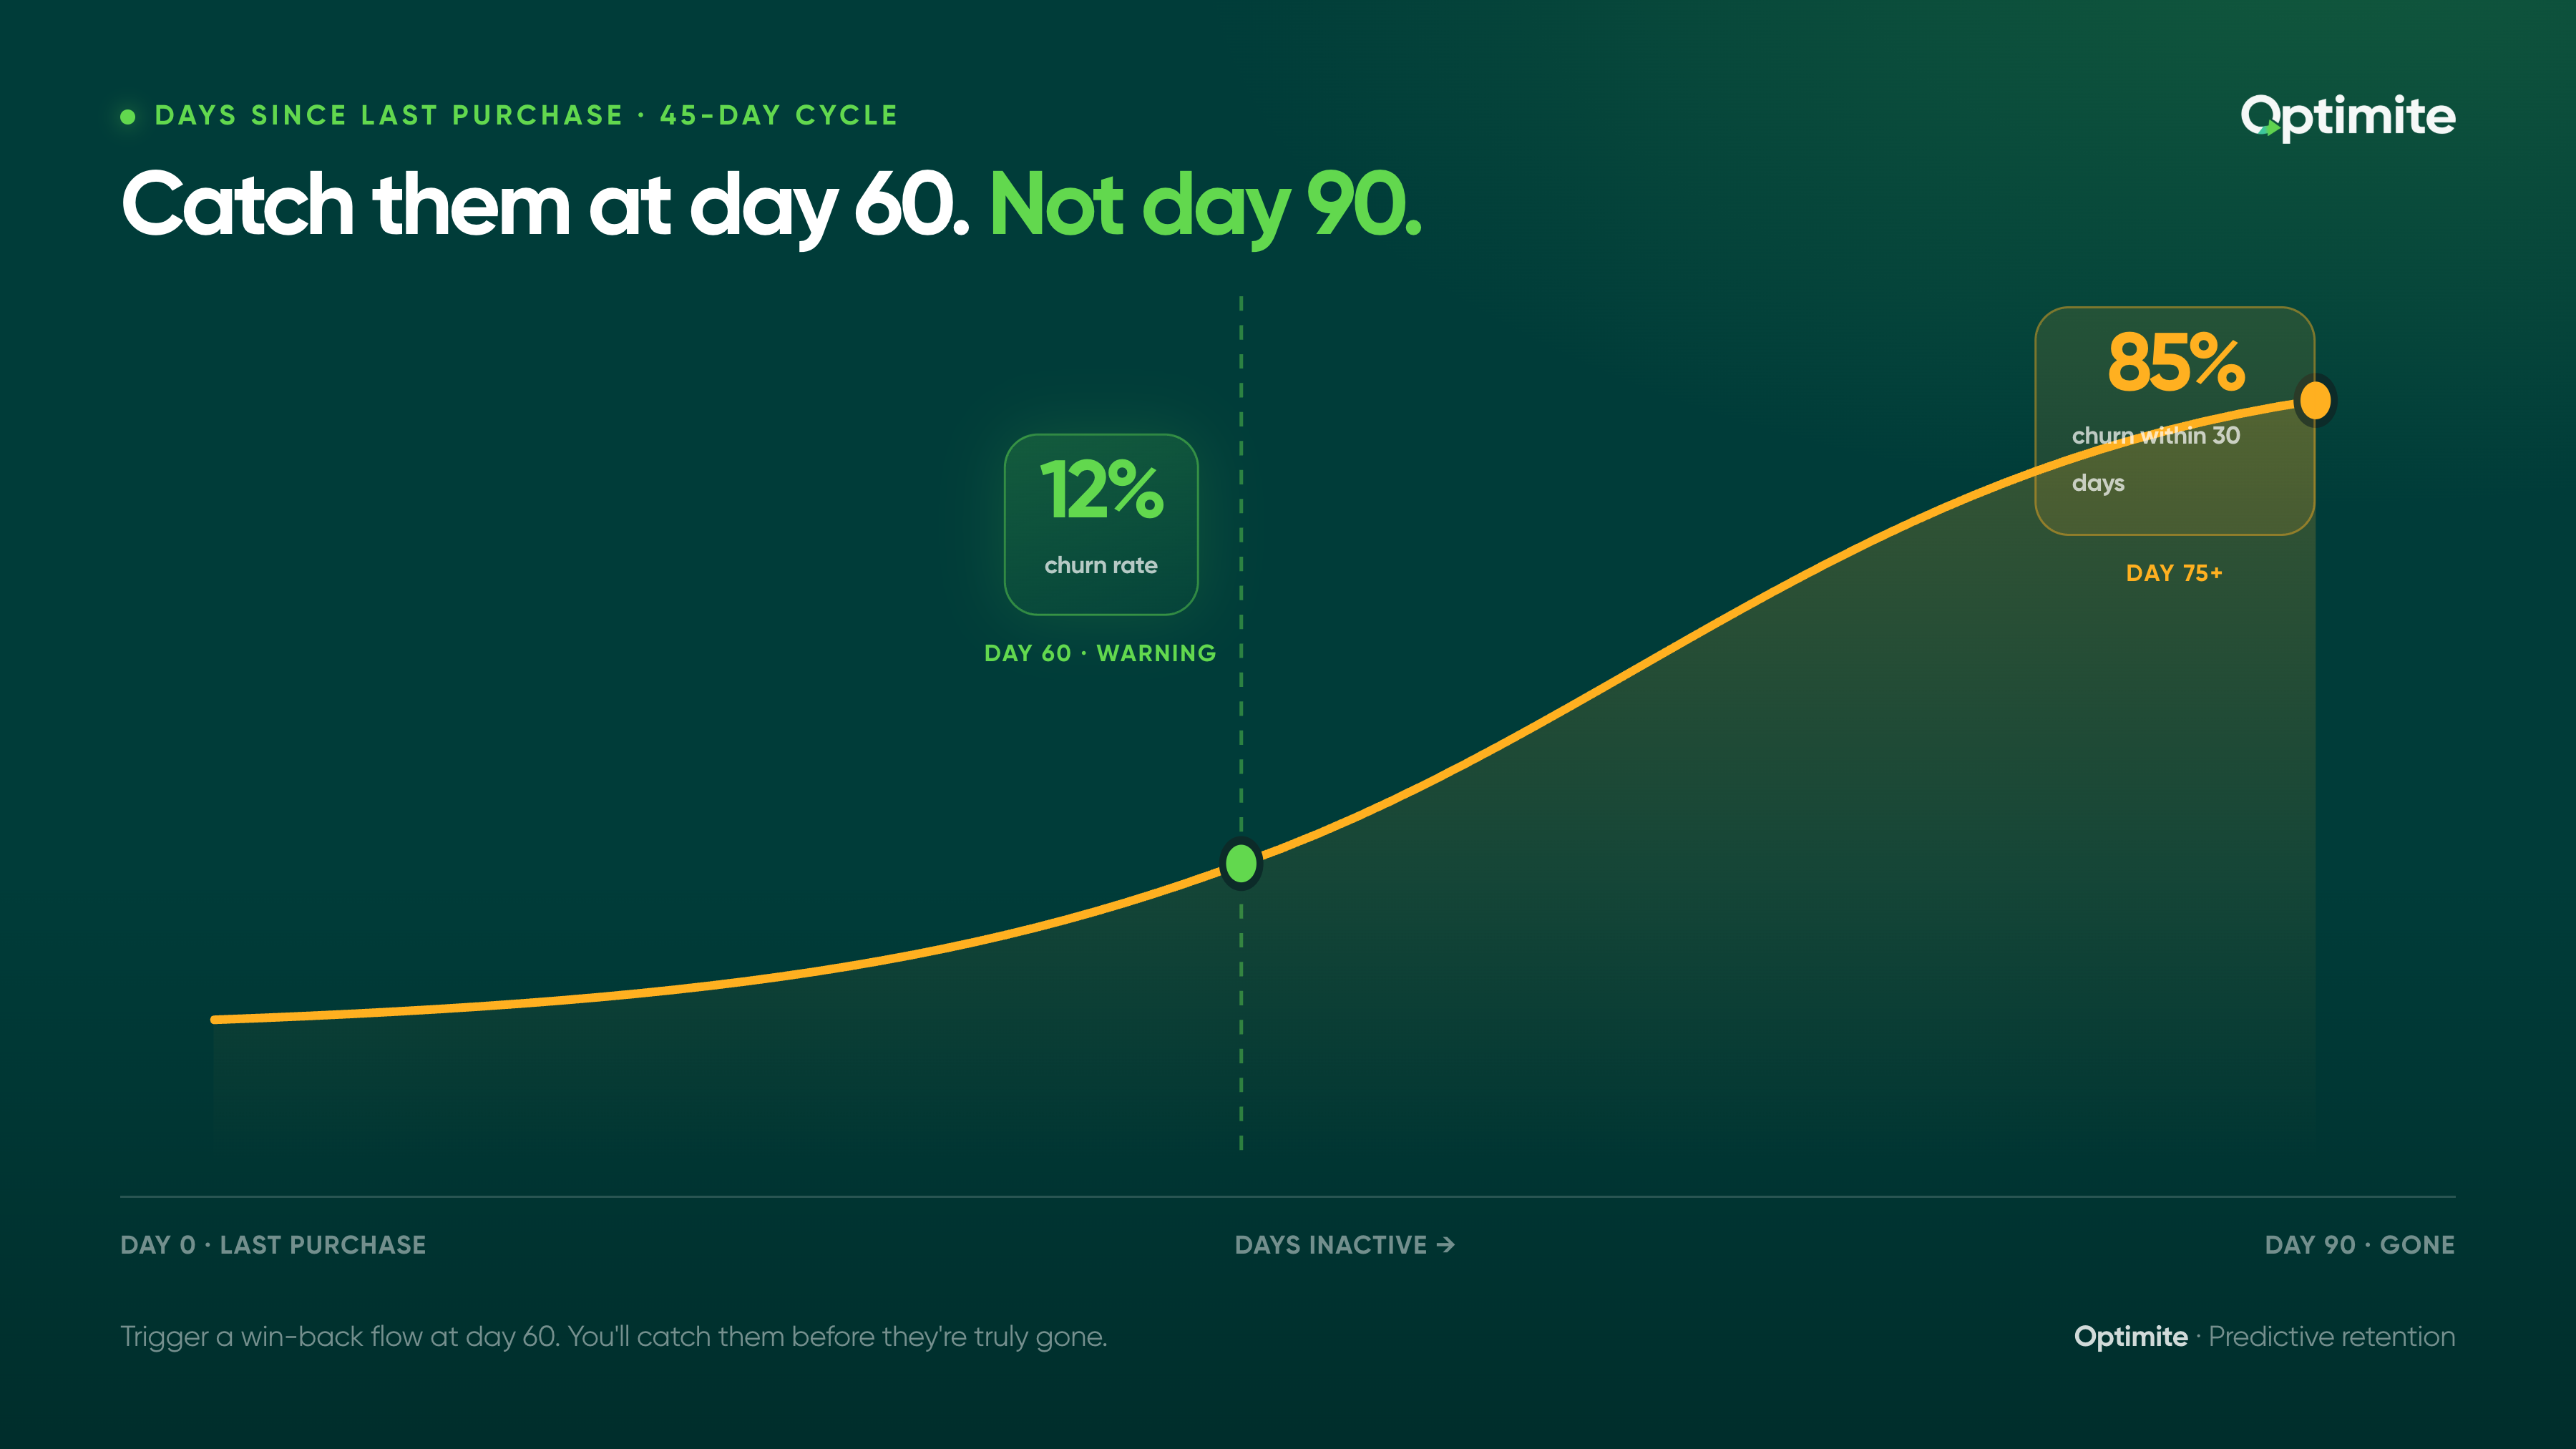
Example: A wellness brand noticed that customers who went 75+ days without purchasing (their cycle is 45 days) had an 85% churn rate within 30 days. Customers at 60 days had only 12% churn rate. That 60-day mark became their early warning threshold.
How to act on it: Set a threshold for your vertical. If a customer hits 60 days and their cycle is 45, that's a warning. Don't wait for 90 days. Trigger a win-back flow at day 60. You'll catch them before they're truly gone.
The sweet spot for intervention is 20-30% past your normal repurchase window. This is where customers are starting to forget about you but haven't yet committed to a competitor.
Metric 2: Purchase Frequency Decline
Some customers buy monthly. Others buy quarterly. The metric that matters isn't the absolute frequency. It's the trend.
Why it predicts churn: A customer who drops from buying 3x per quarter to 1x per quarter is losing interest. This decline often precedes full churn by 60-90 days.
What the warning signal looks like: A 30%+ drop in purchase frequency over a 60-day period. If a customer bought three times in the last 60 days but only once in the current 60 days, that's a warning.
Example: A beauty brand tracked purchase frequency by customer segment. They noticed their VIP segment (high-frequency buyers) dropped from an average of 2.2 purchases per month to 1.3 purchases per month over three months. They flagged this segment and built a VIP re-engagement flow. Frequency climbed back to 2.0x within 60 days.
How to act on it: Calculate average purchase frequency for each customer segment. Set a threshold at 25-30% decline. When a customer hits that threshold, move them into a specific retention flow that acknowledges their drop and offers something exclusive.
Metric 3: Average Order Value Decrease
Some customers are big spenders. Others are steady $30-50 buyers. The warning signal isn't what they spend. It's when they start spending less.
Why it predicts churn: AOV decrease often signals deprioritization. You're becoming less important to them. They're buying smaller quantities or substituting with cheaper alternatives.
What the warning signal looks like: A customer's average order value drops 20%+ compared to their historical average. A customer who usually spends $150 per order is now averaging $110. That's a flag.
Example: A supplement brand noticed their VIP customers (who typically spent $200+ per order) were averaging $120 per order over two months. This signaled they were either buying cheaper products or buying in smaller quantities. The brand created a bundling offer for their VIP segment: "Get 30% off when you buy the complete stack." AOV climbed back to $180 within 30 days.
How to act on it: Track AOV by customer segment monthly. When AOV drops 20%+ for a segment, it's a warning that they're disengaging. Don't ignore it and hope it recovers on its own. Intervene with value-oriented messaging.
Metric 4: Email Engagement Drop
Open rates and click rates tell you if a customer is still paying attention to your messaging.
Why it predicts churn: Customers who stop opening your emails stop buying within 30-60 days. Email engagement is an early warning system.
What the warning signal looks like: A customer's open rate drops below 15% over a 30-day period. Or click rate drops below 3%. These customers are checking out mentally before they check out financially.
Example: A fashion brand segmented their list by engagement. They noticed a segment of 2,000 repeat customers had open rates that dropped from 28% to 9% over 60 days. They moved this segment to a lower-frequency send (once per week instead of three times per week) and personalized subject lines to reference their purchase history. Open rates climbed back to 22% within 30 days. Repeat purchases followed.
How to act on it: Monitor open rate and click rate by customer segment weekly. When a segment's engagement drops 40%+ below their baseline, flag it. Don't send more emails. Send different emails. Lower frequency. Personalize. Change the offer.
Don't respond to engagement drop by sending MORE emails. That accelerates churn. Respond by sending BETTER emails with lower frequency.
Metric 5: Cart Abandonment Rate Spike
Cart abandonment is tricky. It's a leading indicator of churn but also an opportunity. Customers are interested. They're just not completing.
Why it predicts churn: A repeat customer who abandons carts at 2-3x their normal rate is signaling friction. Maybe your prices increased. Maybe they're comparing you to competitors. Maybe shipping costs are too high. Either way, they're losing interest.
What the warning signal looks like: A repeat customer who rarely abandons carts suddenly abandons 50%+ of their cart sessions over a 30-day period.
Example: A food brand noticed one of their best repeat customers abandoned three consecutive carts before finally purchasing the fourth. They sent a personalized email: "We noticed you've been browsing our premium collection. Is there something we can help clarify? Reply here or chat with us." The customer replied: "Your shipping costs have gone up 40%." The brand offered free shipping for the next purchase. Customer came back and spent $120.
How to act on it: Track cart abandonment rate by individual repeat customer. When it spikes, don't assume they're lost. Investigate. They might be seeing friction you can fix. Send a personalized message asking what's wrong. Listen to the response.
Metric 6: Product Return Rate by Customer
Return rates signal satisfaction decline. When a customer starts returning products at higher rates, they're losing confidence in your product or brand.
Why it predicts churn: High returns often precede churn. A customer returns 2-3 products and then stops buying altogether.
What the warning signal looks like: A customer's return rate increases from baseline. If their historical return rate is 8% and it jumps to 25% over 30 days, that's significant.
Example: A beauty brand noticed one of their frequent buyers returned 40% of their orders in the last two months (compared to their historical 5% return rate). They reached out and asked why. The customer said the reformulated facial serum wasn't working like it used to. The brand offered to send them the original formula (which they still had in inventory) plus a complimentary skin consultation. Customer appreciated the responsiveness and came back.
How to act on it: Track return rate by customer segment. When a segment's return rate increases 3x above baseline, flag them for customer service outreach, not win-back campaigns. There's a product or quality issue. Solve it before you try to resell them.
Metric 7: Time Between Purchases Lengthening
This is different from purchase frequency. This measures the gap between each individual purchase.
Why it predicts churn: If a customer's typical gap is 45 days but their last two gaps were 60 and 75 days, the trend is clear. They're slowing down. They'll likely slow down further before stopping entirely.
What the warning signal looks like: The average gap between a customer's last five purchases is 20%+ longer than their historical average.
Example: A supplement brand calculated the average gap between purchases for each customer. A customer's historical gap was 42 days. Their last three gaps were 48, 56, and 64 days. The trend showed lengthening. The brand triggered a "we miss you" sequence at day 70, before they hit 90 days of inactivity. The customer responded and purchased.
How to act on it: Calculate trend-based gaps, not just absolute time. If gaps are lengthening, intervene early. Don't wait for the next gap to be 120 days.
Brands using trend-based churn prediction catch 40-50% more at-risk customers before they fully churn compared to brands using fixed thresholds.
Metric 8: Customer Engagement Score
This is a composite metric that combines purchases, email engagement, click activity, and time since last interaction into one health score.
Why it predicts churn: A single metric is always wrong. But a composite score that weighs multiple factors catches the nuance. A customer might have low purchase frequency but high email engagement (still interested, just not buying yet). A composite score captures that.
What the warning signal looks like: An engagement score trending down for 60+ consecutive days.
Example: A fashion brand built an engagement score: (recent purchases × 3) + (email opens × 1) + (clicks × 2) + (days since purchase adjustment). Scores ranged from 0-100. Customers scoring above 70 were healthy. Below 40 were at-risk. They noticed a segment of 500 customers dropped from an average score of 65 to an average score of 38 over 60 days. They segmented this group into a re-engagement campaign. Half responded to a "20% off, no strings attached" offer. Half remained silent and churned.
How to act on it: Build an engagement score using your four most important metrics. Weight them based on what matters most (purchases usually matter most, 3x. Engagement matters 1-2x). Track the trend. When scores trend down for 60+ days, intervene.
Building Your Early Warning System
These eight metrics work best as a system, not individually. You don't act on one metric. You watch all eight.
A customer with high purchase frequency but low email engagement needs different treatment than a customer with declining AOV but stable frequency.
The brands winning at retention aren't reacting to churn. They're predicting it. They're watching these eight metrics. When one changes, they investigate. When multiple change, they act.
Start this week. Pick one metric from this list. Calculate it for your top 100 repeat customers. See what the distribution looks like. Where are the warning signals? Which customers are trending down?
Then build a simple automation: when a customer hits that warning threshold, flag them for manual review or move them into a retention flow.
The investment is small. The upside is massive. Preventing one VIP from churning is worth more than acquiring five new customers.
Want help building a churn prediction system for your Shopify store or auditing which customers are at risk right now? Let's talk. We work with Shopify brands to build predictive retention systems that catch at-risk customers before they leave. See how we've helped brands across wellness, fashion, beauty, and food and beverage reduce churn by 30-50% using data-driven early warning systems.


